In week 42 we added the following reports:
- Techno-economic uptake potential of zero- emission trucks in Europe | TNO, Transport & Environment
- Zero-Emission Vehicles Progress Dashboard | BloombergNEF
- Insights into electric vehicle ownership | The electric vehicle council
- Electric vehicle charging infrastructure trends from the alternative fueling station locator: first quarter 2022 | NREL
- Road freight decarbonization in Europe | ICCT
The reports are shared and available free of charge in our database.
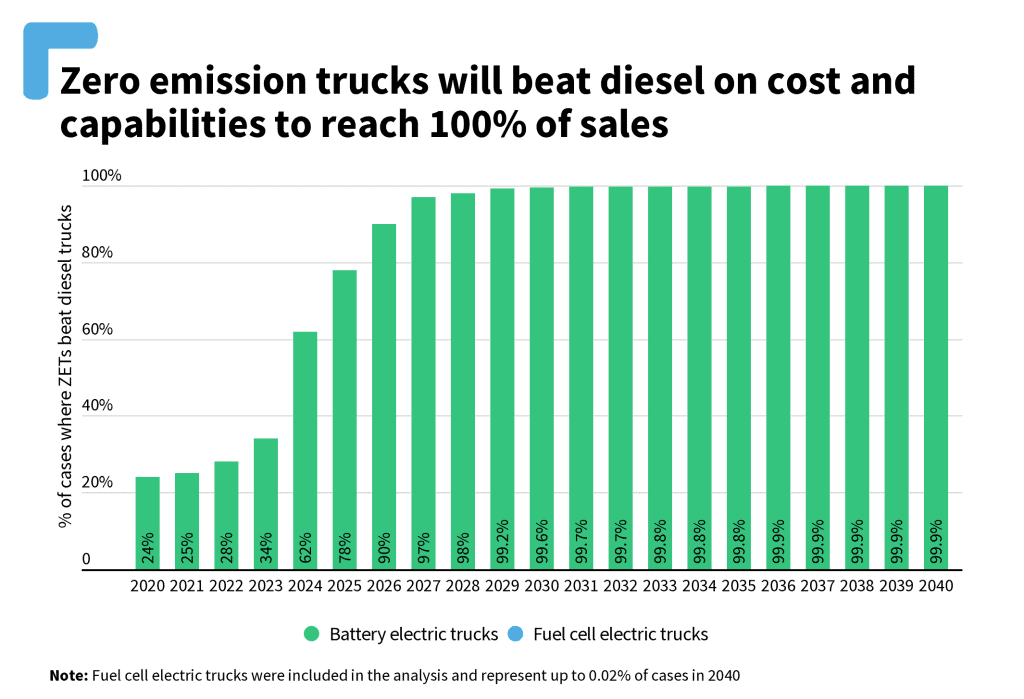
By 2035, electric trucks will be cheaper and capable of driving as far as diesel trucks
There is growing understanding among regulators and industry stakeholders that zero emission trucks are the best solution to decarbonize the road freight sector. However, the rate of transition from internal combustion engine cars (ICEVs) to BEVs and FCEVs is not yet evident to everyone.
This report by TNO examines the technical and economic feasibility of attaining 100% zero-emission vehicle sales delivery vehicles, as well as long-haul trucks. It also addresses the question of whether and how quickly Europe can achieve 100% zero-emission freight vehicle sales.
Techno-economic uptake potential of zero- emission trucks in Europe | TNO, Transport & Environment
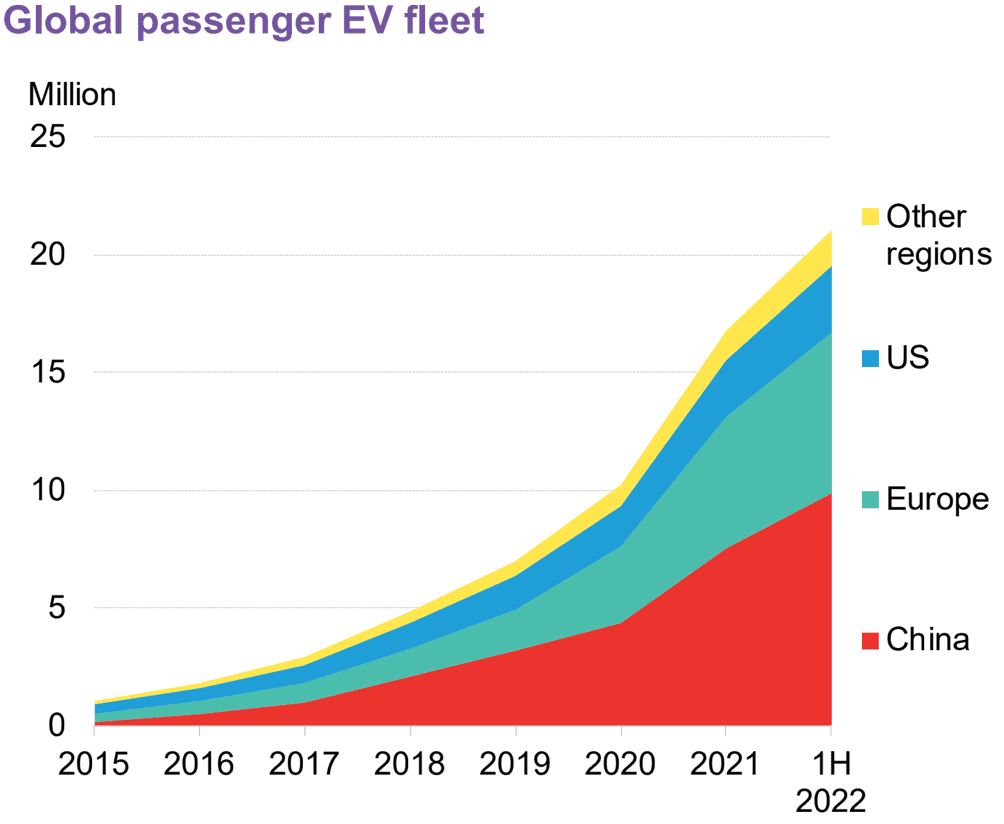
Get a grip on the state of the global EV industry
In the first half of 2022, global passenger EV sales increased by 63% to 4.3 million electric vehicles sold. Since 2015, China and Europe have led the worldwide passenger EV market, accounting for 84% of global EV sales in the first half of 2022.
This report by BloombergNEF aims to track statistics on ZEV adoption, charging infrastructure deployment and automakers’ ZEV sales, including data of the first half of 2022. It is focused on ZEV Transition Council countries
Zero-Emission Vehicles Progress Dashboard | BloombergNEF
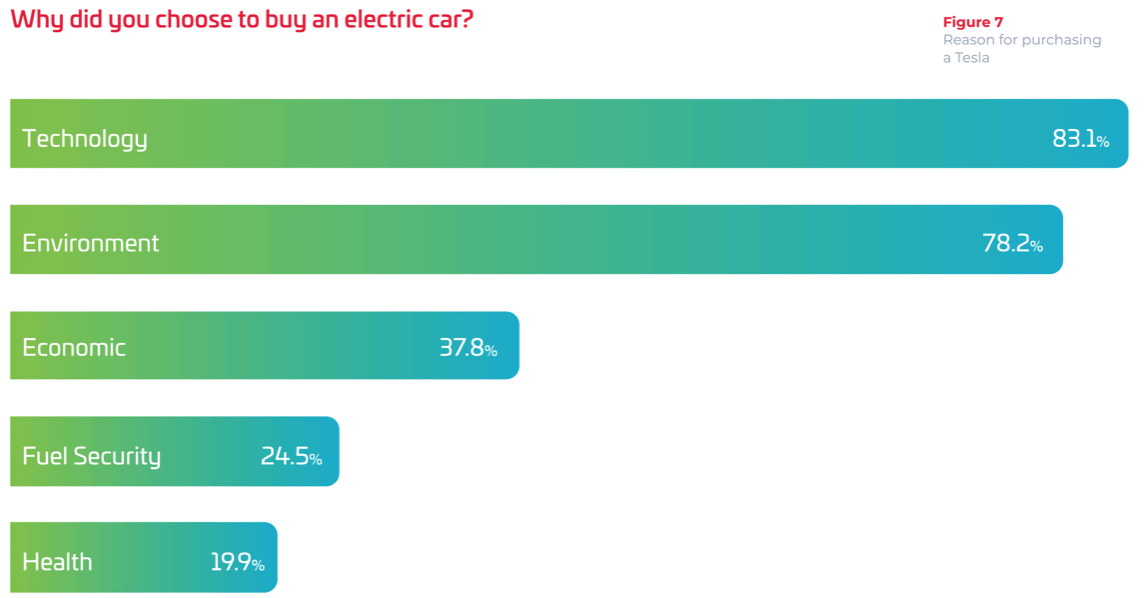
Which kinds of consumers are interested in purchasing an electric vehicle?
While there is growing interest in electric vehicles (EVs) in Australia, as well as the critical role this technology will play in the transition to net zero emissions, there is still a lack of data on what types of consumers buy EVs, how they drive and charge their vehicles, and what costs they incur while owning an EV.
The intention of this report, based on a survey of 741 Tesla owners, is to assist policy-makers in planning for future EV uptake, learning from the insights of existing EV owners.
Insights into electric vehicle ownership | The electric vehicle council
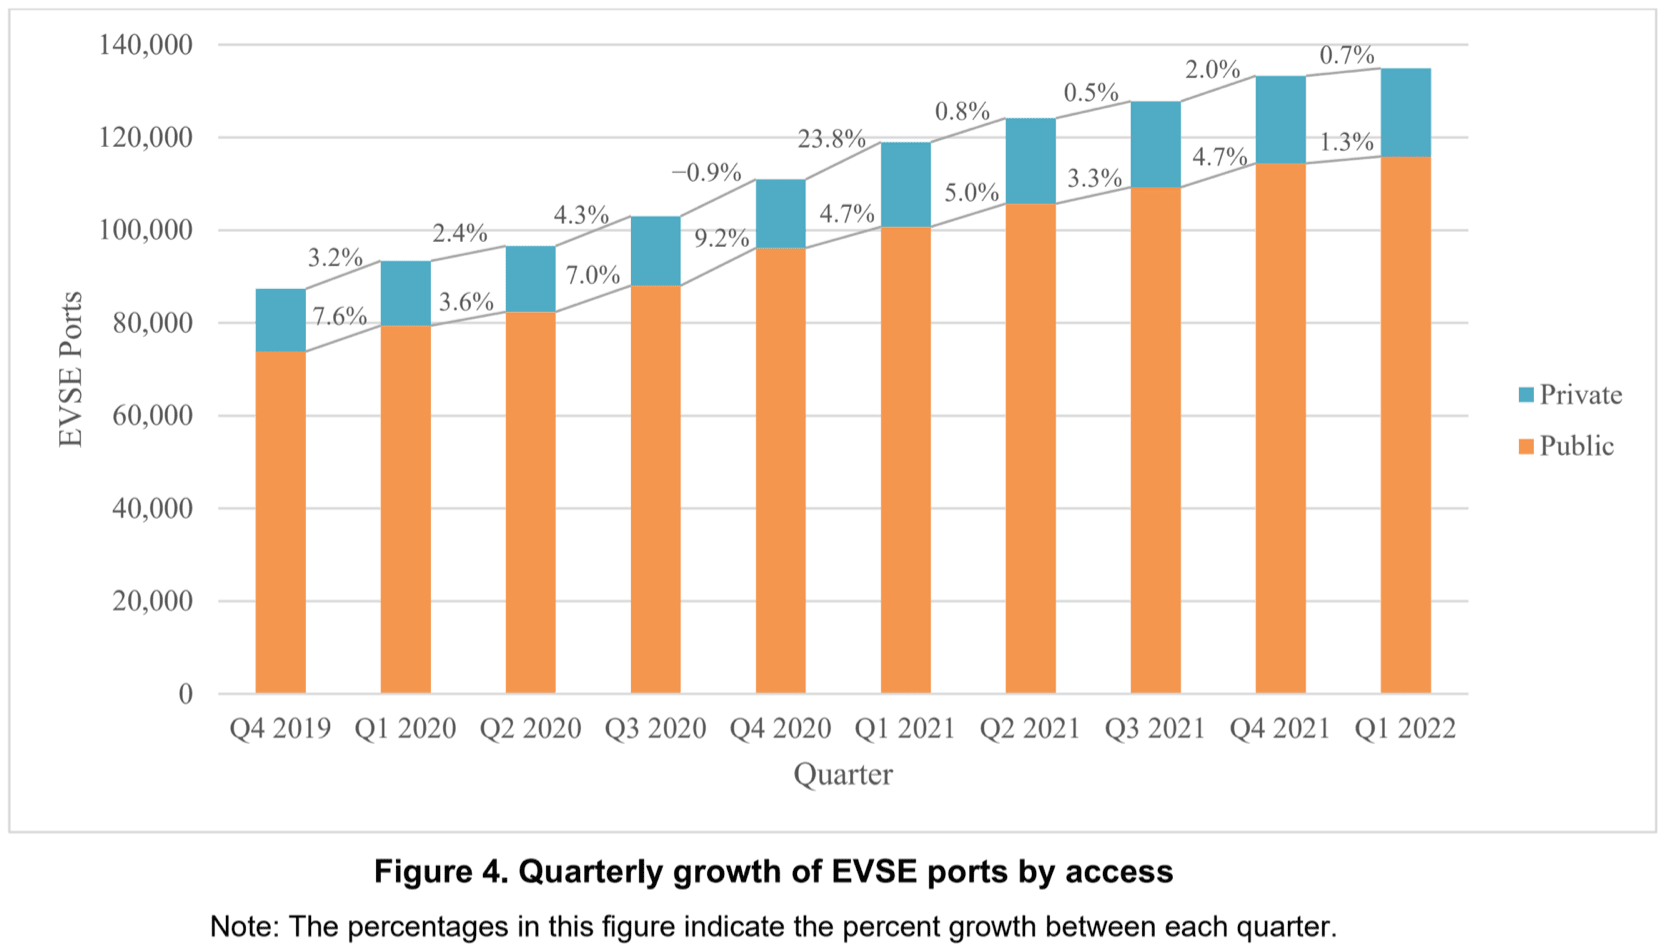
The American EV charging infrastructure developments
The number of electric vehicle supply equipment (EVSE) ports in the Station Locator increased by 1.2% in Q1 2022, with a 1.3% rise in public EVSE ports and a 0.7% increase in private EVSE ports.
This report provides a snapshot of the state of EV charging infrastructure in the United States in the first calendar quarter of 2022 (Q1 2022).
Electric vehicle charging infrastructure trends from the alternative fueling station locator: first quarter 2022 | NREL
Planned and produced electric trucks
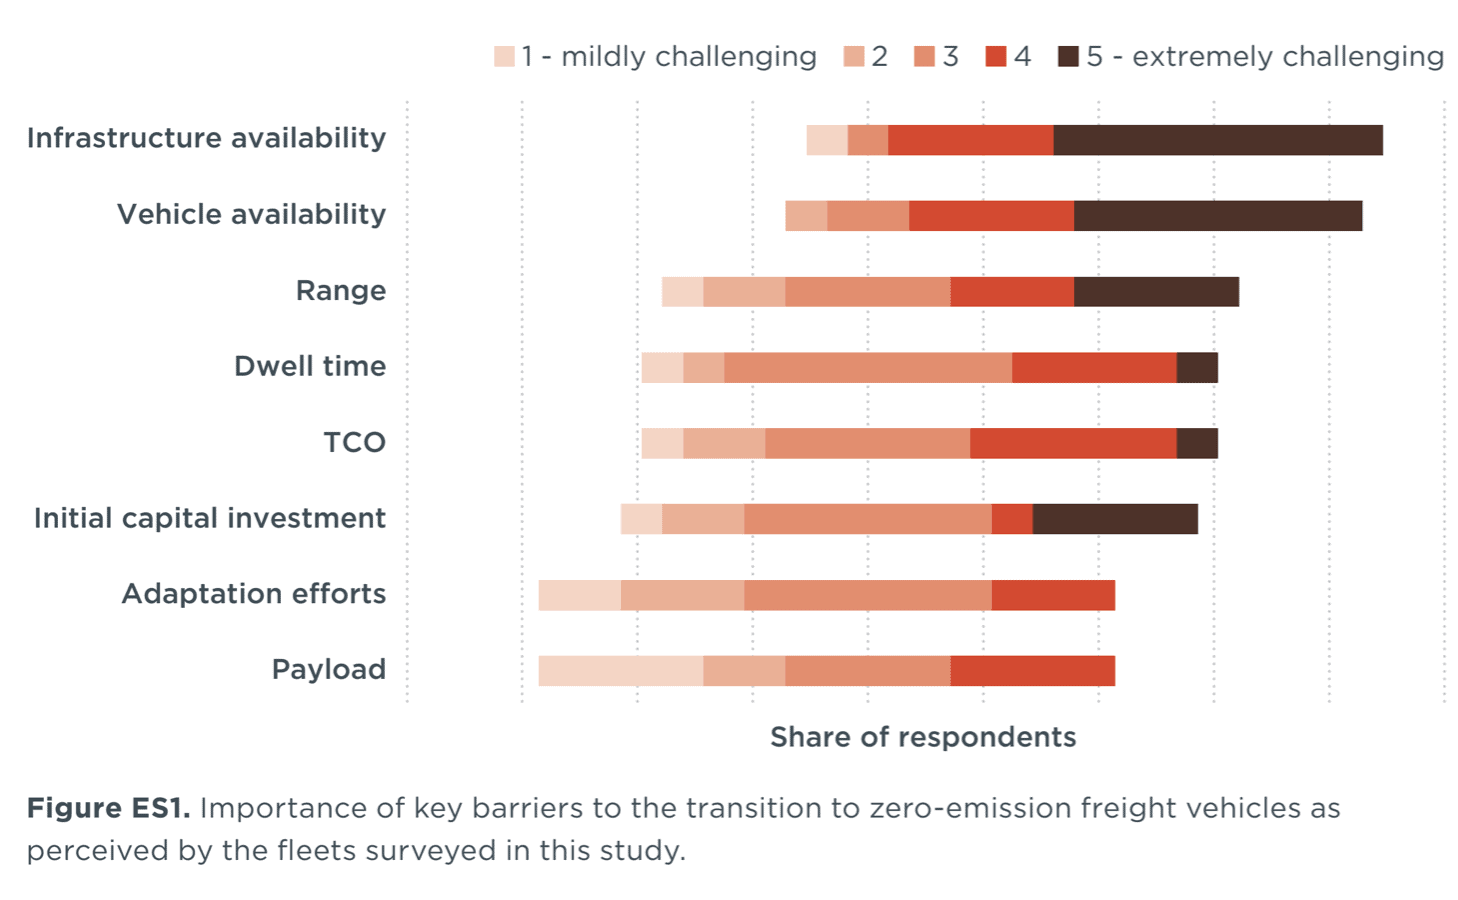
Global supply chains are increasingly being held accountable for their climate effect and are actively exploring decarbonization measures. Because road freight contributes significantly to overall greenhouse gas emissions in Europe, there is a rising push to switch to zero-emission truck fleets.
This study explores the readiness of the European truck fleets to transition to zero-emission vehicles.
Road freight decarbonization in Europe | ICCT
That’s it for this week; we’ll be back next week with new reports curated just for you. Next week, we will also release a new highlighted report in which we summarise a study on the mass adoption of electric vehicles. Have a wonderful week and till next time!